Core Concepts
Before diving into configuration and features, it's important to understand a few core ideas that guide how Osprey works. These concepts form the foundation of Osprey's approach to automated data quality monitoring and troubleshooting.
Data Lineage
How Osprey tracks data flow between assets
Data lineage is the map of how information flows through your system, from sensors to calculations, dashboards, and reports. In Osprey, lineage helps you understand:
-
Which assets depend on others
-
Where a data issue may have originated
-
What downstream systems might be affected by a configuration change or data issue
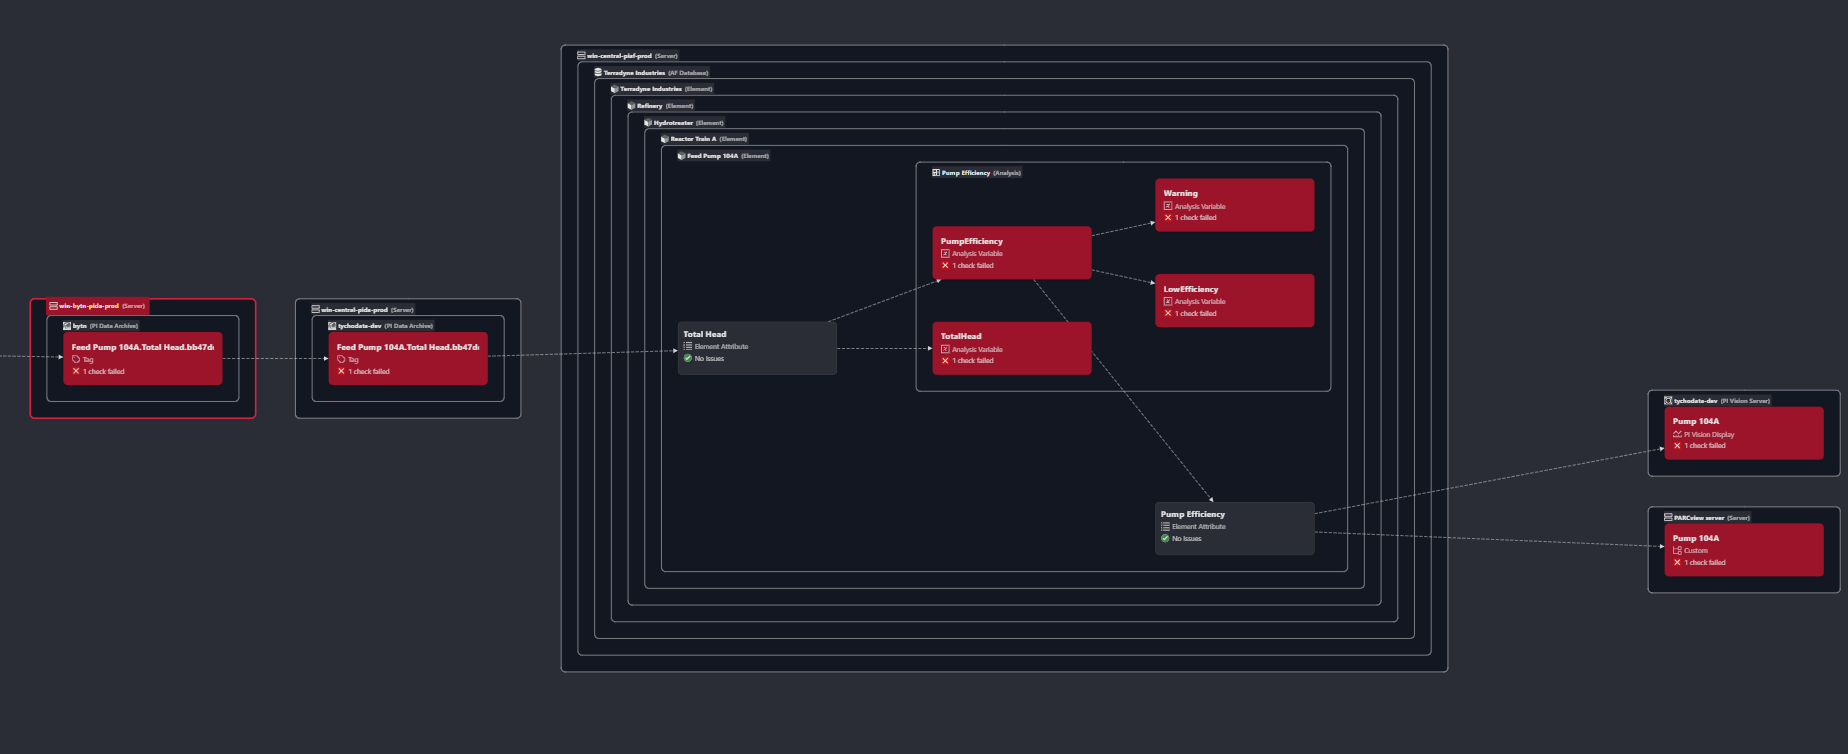
Osprey automatically builds a directed graph of relationships between assets, such as:
-
PI Tag ➜ AF Attribute ➜ PI Vision Display
-
Flow Rate Sensor ➜ Totalizer ➜ PI Vision Display
Lineage allows you to answer questions like:
"If this sensor is flatlining, which calculations or displays are no longer reliable?"
Blast Radius
Understanding downstream impact of data issues
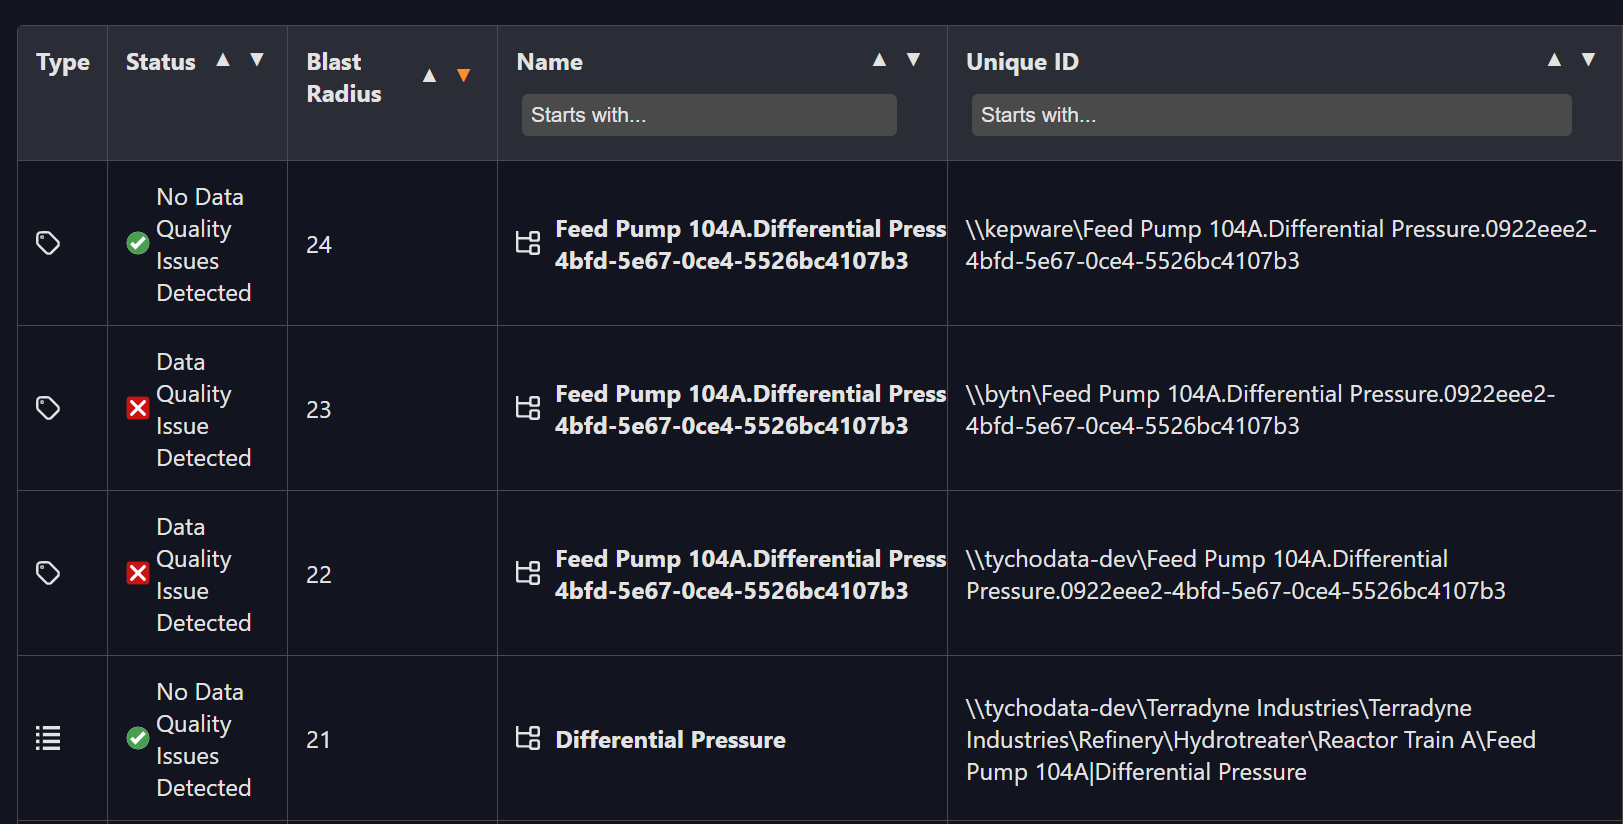
The blast radius represents the full extent of an issue's impact, not just where it happened, but everywhere it spreads.
For example, a stale flow sensor may feed into:
-
An asset totalizer
-
A PI Vision trend
-
A regulatory report
Osprey automatically calculates the blast radius of each data quality issue using the lineage graph, so you can:
-
Quantify the scope of bad data
-
Prioritize which issues to fix first
-
Notify the right downstream users
You'll see blast radius information attached to each issue and summarized in dashboards.
Data Quality
How Osprey defines and evaluates it
At its core, data quality is about trust. Osprey evaluates the quality of your data based on:
-
Timeliness - Is the data arriving at expected intervals?
-
Freshness - Has the value updated recently?
-
Compression - Is there data loss due to compression?
Osprey runs automated checks on each asset to assess these aspects. Failed checks become issues, and can trigger alerts or visual indicators.
Data quality isn't just binary, it's contextual. You can tailor checks based on the asset type, its business importance, or regulatory needs.
Checks
Common check types include:
| Check Type | Description |
|---|---|
| Freshness | Has the value updated within the expected interval? |
| Bad Data | Does the tag or attribute have a current status of Bad? |
| PercentGood | Does the tag have a bad value during the scan period? |
| No Data | Is the tag or attribute missing data? |
| Value is Pt Created | Is the value of the tag Pt Created |
| Value is Configure | Is the value of the tag Configure |
| Duplicate Tag | Does the tag have the same point source, location1, and instrument tag fields as another tag |
| Reference Tag does not exist | Does the AF Element Attribute reference a non-existent tag |
| Overcompression | Is the tag's CompDevPercent > 1% and span > 100 |
| Undercompression | Is the tag's Compressing turned off |
| Contains Bad Data | Does a display contain bad data |
Osprey handles scheduling, evaluation, and issue generation, all automatically.
Domains
Segmentation of responsibility, ownership, and scope
Domains let you segment your environment into logical groups of assets, often by site, department, or system.
Each domain in Osprey has:
-
Its own set of assets
-
Separate ownership and permissions
-
Configurable scanners, checks, workflows, and labels
Domains make it easy to:
-
Delegate responsibility (e.g., one team per plant)
-
Enforce access control
-
Customize quality policies per group
Think of a domain as a workspace: it's where you scan assets, configure checks, and monitor data quality, all scoped to your area of ownership.